|
. Prediction method . Prediction accuracy . How to use POODLE-L . Result page . Ackonwledgment . Publication . Contact Us What's POODLE-L ? Recently, many proteins lacking well-defined three-dimensional structure have been reported. These phenomena in the physiological condition are common. Genomic analysis of disordered regions indicates that the proportion of protein including long disordered regions increases with the complexity of organisms. In spite of lacking folded structure, it is apparent that they play fundamental roles in biological activities, such as, signal transduction and cell cycle control. They are therefore important for understanding protein functions. On the other hand, in structural genomics, long disordered regions hinder determining protein structure in X-ray crystallographic analysis or NMR because those regions have very high mobility. So, it is improtant to predict such regions from primary sequence to accelerate the research or to save money and time. For such reasons, POODLE-L aims to predict long disordered regions.  Prediction method Training dataset (TDS) was consisted of two type data. Ordered regions were collected from proteins in the Protein Data Bank taht include no disorder region or short disordered region (shorter than 30aa). Disordered regions (longer than 40aa) consisted of long disordered regions and wholly unfolded proteins, which were collected from Uversky's (Uversky et al. Proteins, 15:415-27) and DisProt ver. 2.2 datasets. POODLE-L has two-step prediction using SVM (Supprot Vector Machine). In the first step, it predicts whether sequence of window-size 40aa is disordered using 10 physicochemical discriptors obtained from sequences. In the second step, it predicts whether residues are disordered based on the distribution of probabilities obtained in the first step. 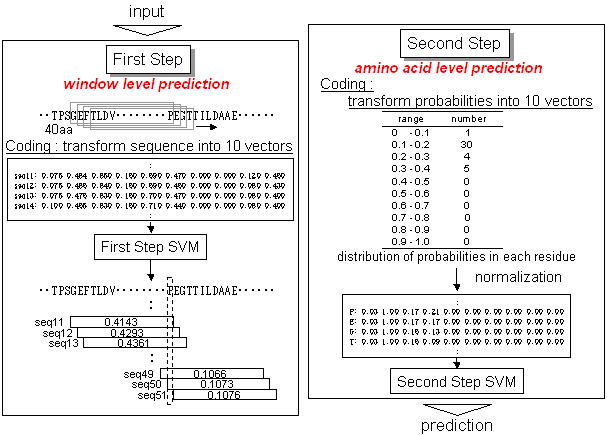 Next, 63 models are created by changing 6 physicochemical discriptor groups, into which the 10 parameters in the first stepi are classified based on physicochemical properties. Prediction accuracy of all models are estimated using assessment dataset 2 (ADS-2) including 15 sequences with no disorder region and 11 sequences containing one or more long (≥30aa) missing regions in PDB, and several good prediction models are then picked up compraring with the original model, which is created by using all physicochemical parameters in the first step. POODLE-L system integrates them by adopting the regional consensus of 10 models. 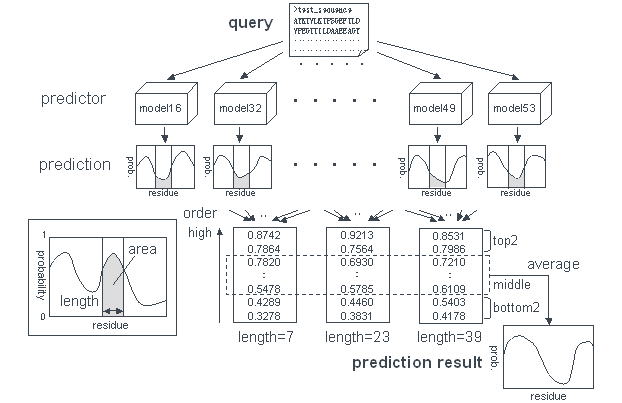
Prediction accuracy Prediction accuracy was estimated and compared POODLE-L with publicly available disorder prediction systems, namely DSIOPRED2, VSL2, VL3H, DisEMBL(REMERK 465), RONN, FoldIndex, FoldUnfold and IUPred(long). An assessment dataset 1 (ADS-1) has 116 sequences and consists of two data types. One consists of proteins with no disorder region, the other consisting of proteins including long (≥30aa) disordered regions. Receiver Operating Characteristic (ROC) curves are drawn.  Also, the area of ROC curve (SAUC>) was claculated. Next, sensitivity(Ssens), specificity(Sspec), the Matthews correlation coefficient(SMMC) and Sproduct are used to evaluate prediction accuracy as follows 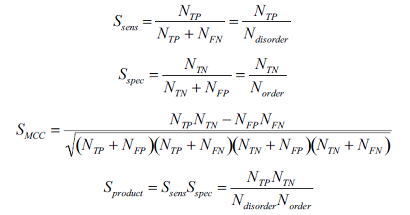 Each of NTP,NFP,NTN and NFN indicates the number of true positives (i.e. predicted and experimentally disordered), false positives, true negatives and false negatives, respectively. The table below shows the result. 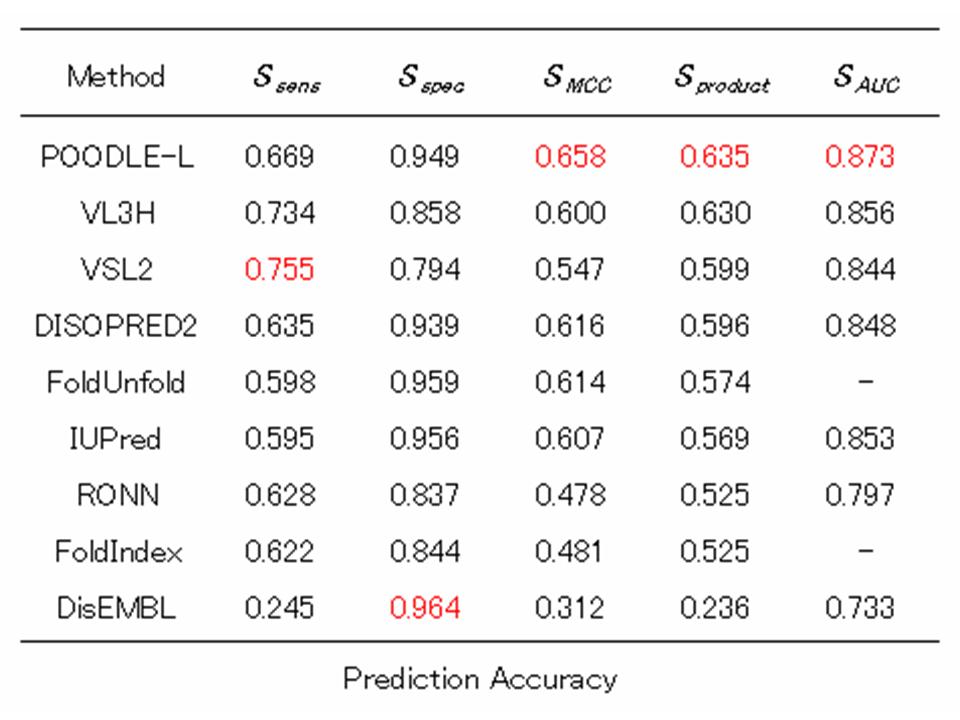 How to use POODLE-L ? 1. Enter sequence Please input an amino acid sequence to the sequence data box by a single protein sequence in plain text or in FASTA format. 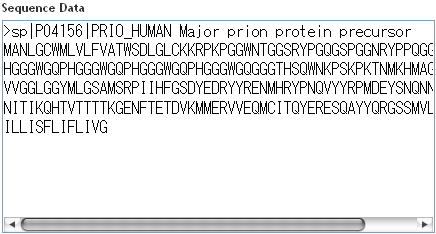 in FASTA format First line : begins with ">", alphanumeric characters and spaces can be used. Second line and further : single-letter AA code and X can be used. example data 2. Click "submit" button If you click "submit" button, POODLE returns the results. If you click "clear" button, the sequence in the sequence box is removed. Result page POODLE calculates disorder probability for each amino acid residue. Disorder probability shows the likehood of disorder region ranging from 0 to 1. The prediction becomes more reliable as the disorder probability becomes higher. Just like CASP format, if disorder probability is greater than 0.5, the amino acid is predicted as disorder region. The results of the disorder prediction are shown in two different form. GRAPH VIEW 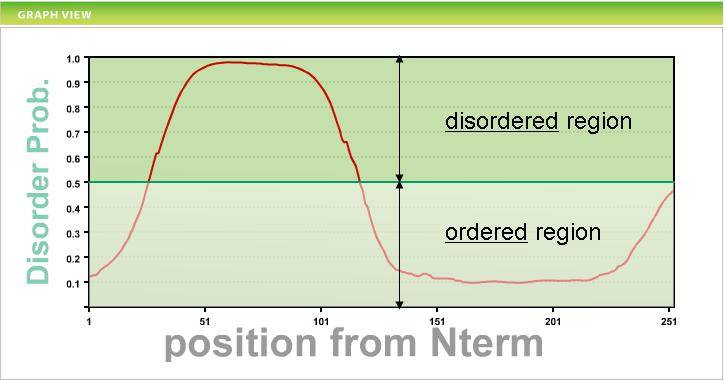 vertical axis : disorder probability horizontal axis : residue number TEXT VIEW 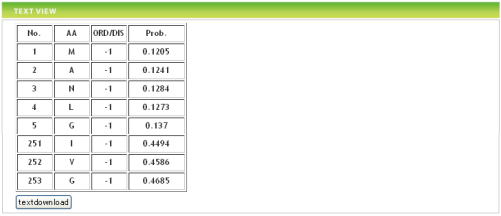 No. : residue number AA. : amino acid residue ORD/DIS : disorder => 1 , order => -1 Prob. : disorder probability If you click "text download" button, text data can be downloaded by CSV format. Acknowledgment The libSVM package from Dr. C. Chang and C. Lin of National Taiwan University. Go to the libSVM page Publication S. Hirose, K. Shimizu, Y, Kuroda and T. Noguchi "POODLE-L: a two-level SVM preidction system for reliably predicting long disordered regions" , Bioinformatics 2007 23(16) 2046-53. Contact Us  |